
In today’s world of connected and safety-critical systems, it’s crucial to spot cybersecurity risks as early as possible. One smart way to do this is by using the STRIDE method, which offers a well-established methodology to identify threats, especially across trusted boundaries.
STRIDE stands for:
Spoofing – Pretending to be someone else
Tampering – Changing data in an unauthorized way
Repudiation – Denying an action or hiding who did it
Information Disclosure – Leaking private or sensitive data
Denial of Service – Making a system or service unavailable
Elevation of Privilege – Gaining more access than allowed
Introduction
This white paper shows how you can use STRIDE directly within your development work using Polarion ALM and enhanced by Nextedy Risksheet. Instead of a complex setup or navigating links between work items, you get a familiar, Excel-style view where everything is easy to track and update. The data model comes from a default STRIDE Demo Template with the necessary work item types, columns, and enums already defined.
Why STRIDE-Based Threat Modeling is Needed
Early Threat Discovery: Identifies critical cybersecurity weaknesses early in the system design.
Systematic Analysis: STRIDE gives a Checklist-style way to think through possible threats to your system.
Trust Boundary Enforcement: helps us spot risks when information moves between different systems or parts of a system, especially where control or security might change
Industry Compliance: STRIDE supports compliance with standards such as ISO/SAE 21434, IEC 62443, and medical or aerospace cybersecurity guidelines.
STRIDE Threat Modeling Workflow in Polarion
You don’t need to be a Polarion expert or know how to configure its internals.
Here’s what you can do with the Risksheet tool instead:
Phase 1: Identify system components and define trust boundaries.
Phase 2: Apply STRIDE to each part and record potential threats, mitigations, and risk assessments.
Phase 1: Interface Classification (Interfaces Sheet)
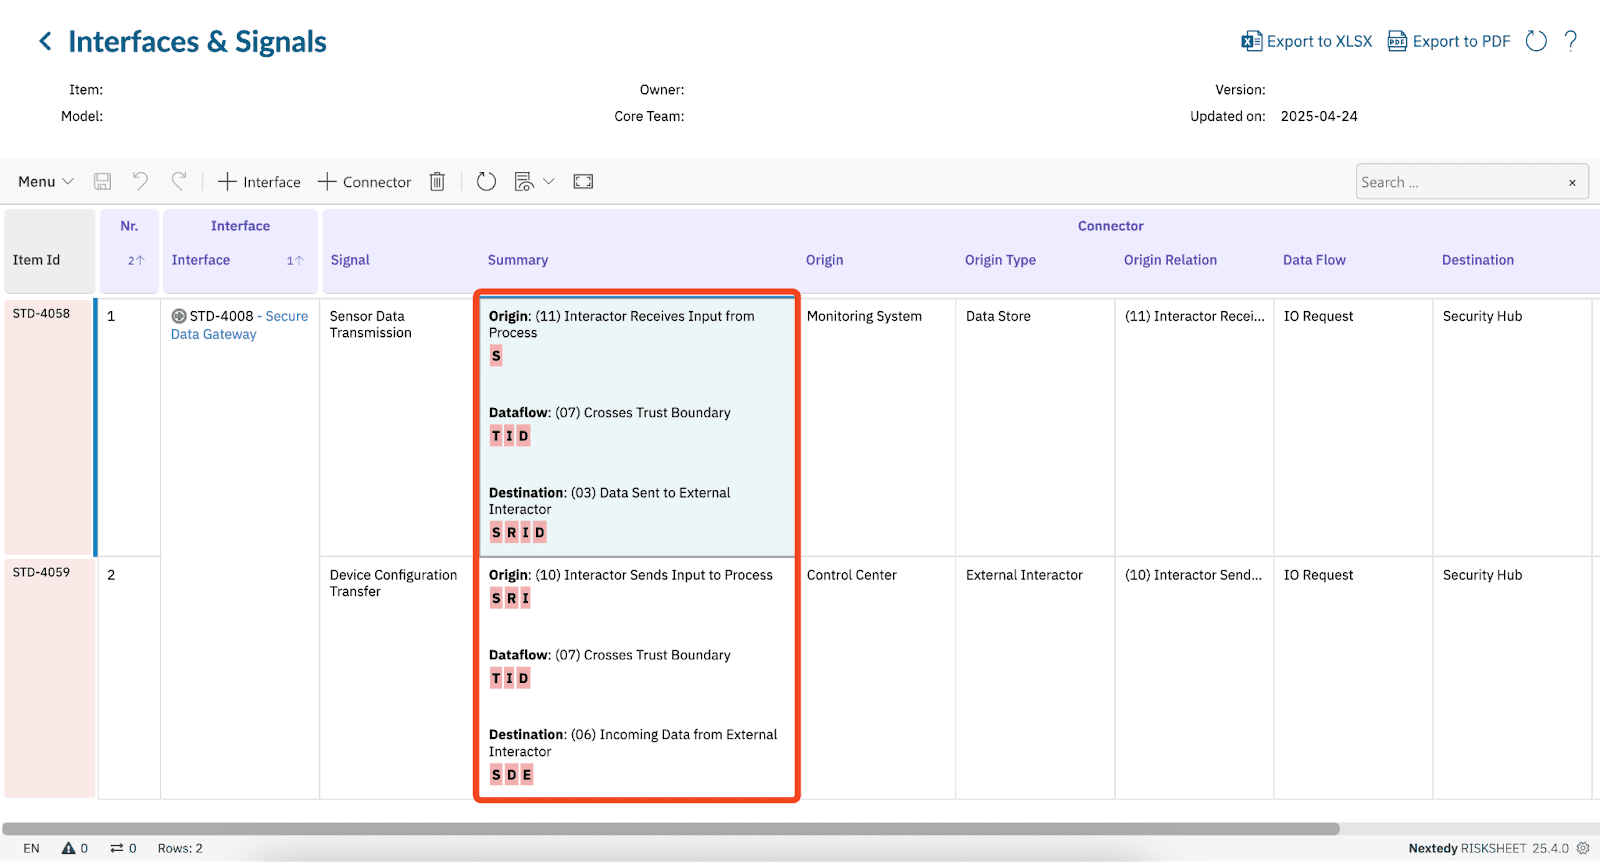
In this first step, you look at how different parts of your system communicate — for example, how a sensor sends data to a control unit, or how software talks to hardware. We call these connections “connectors.”
Using the Interfaces sheet (which looks like a simple spreadsheet), you answer questions like:
Where is the data coming from? (Origin)
Where is it going? (Destination)
What kind of data flow is it? (Flow direction)
This helps paint a clear picture of how your system is structured and where data moves. Once that’s mapped out, the tool can automatically suggest which kinds of STRIDE threats you should watch for, depending on how that data moves.
By understanding where data travels and who sends/receives it, you can:
Spot areas where threats are most likely to happen
Set the stage for more detailed threat modeling in the next phase
Avoid overthinking — the tool helps highlight only the relevant threats for each connection
If you’ve built your system in a tool like Enterprise Architect, you can easily export your data and bring it into Polarion.
Each signal becomes one row in the sheet.
Once the signals are listed, you review them to see which ones cross trust boundaries — this means data going between different systems, departments, or security levels.
These are the signals that are most important to analyze for security threats using STRIDE.
You use the “Origin Relation” and “Destination Relation” columns to describe what’s on either side of the signal.
Based on this interaction, the tool suggests which STRIDE threat types might apply.

Phase 2: Assessing Cybersecurity Risks (TARA Sheet – Threat Analysis & Risk Assessment)
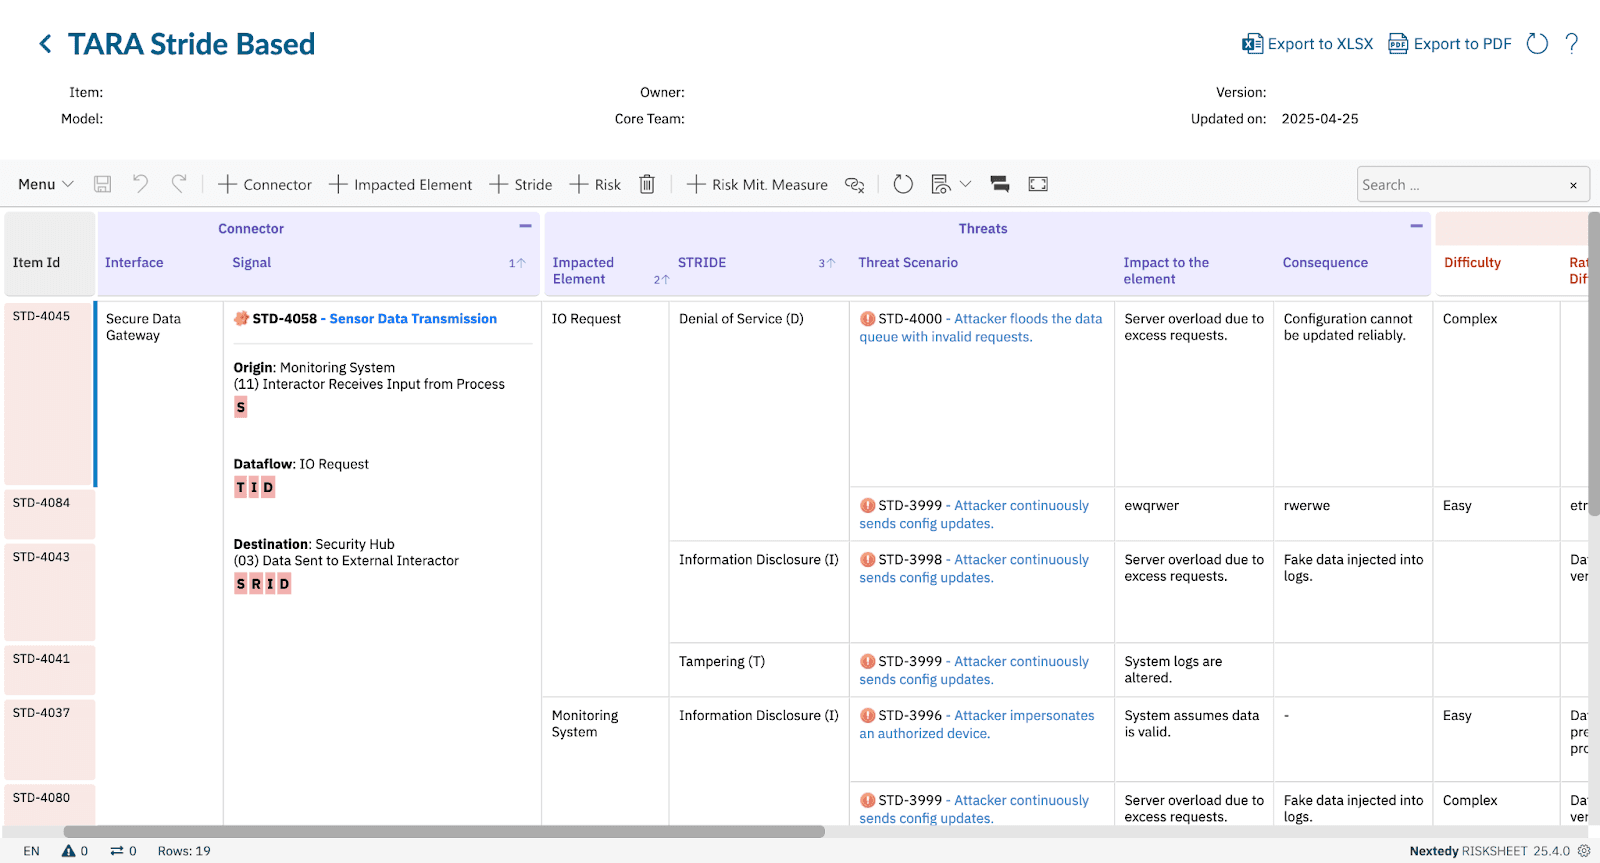
Once you’ve identified the important connections in your system (from Phase 1), it’s time to assess the real cybersecurity risks they pose. This happens in the TARA sheet, which works just like a spreadsheet — simple, clear, and no special skills required.
For each applicable threat category, users evaluate impact, document threat scenarios, perform risk scoring, and define mitigations.
Here’s How It Works:
The tool already knows which types of threats (Spoofing, Tampering, etc.) might apply to each signal.
You’ll see one row for each relevant STRIDE threat.
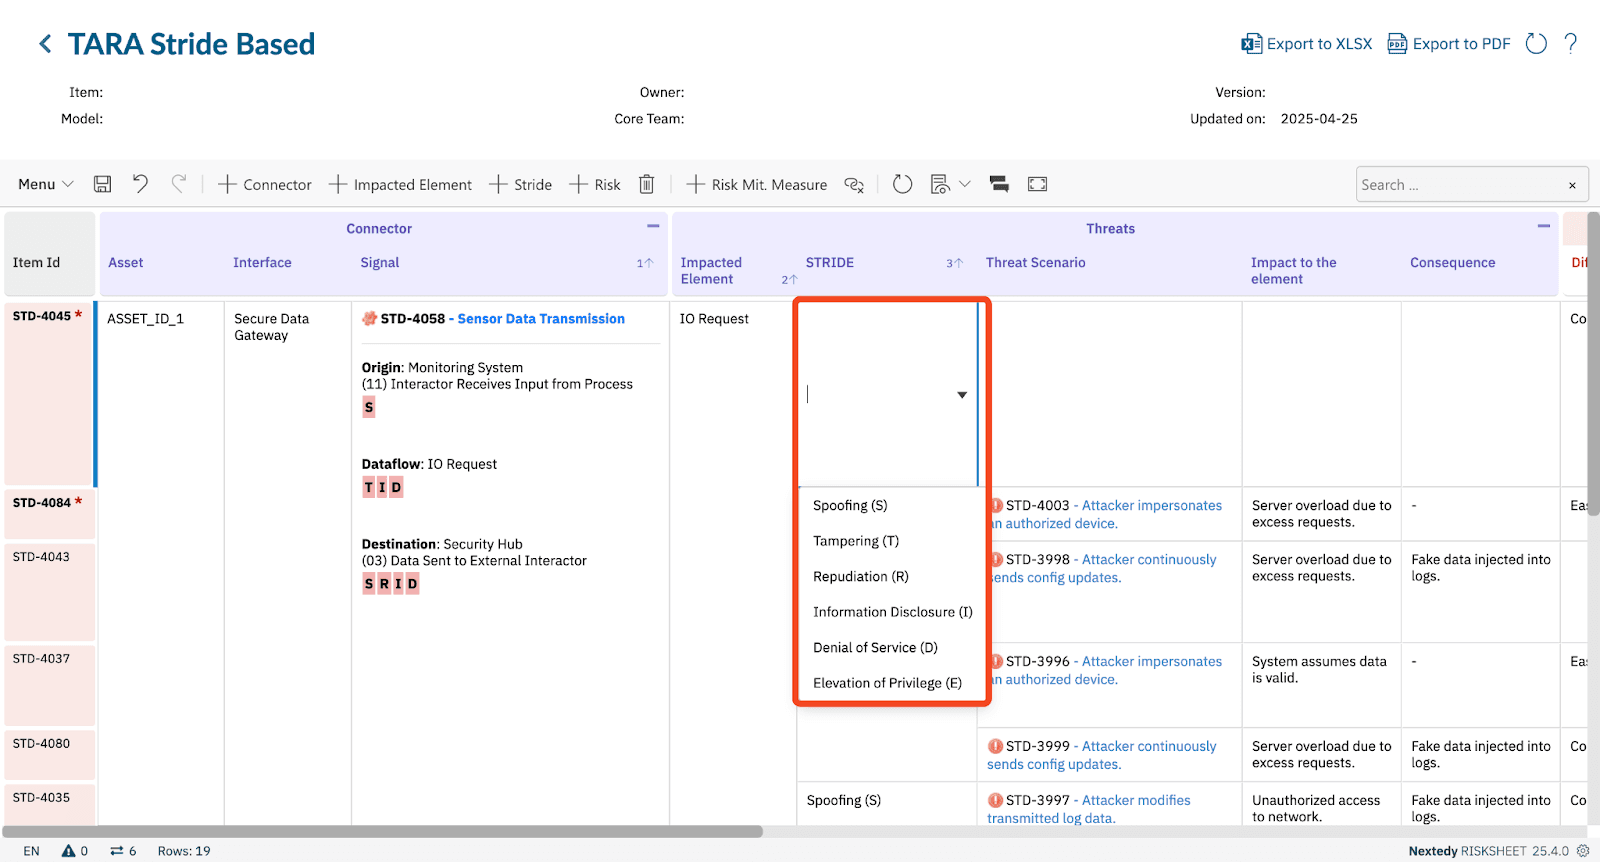
In the “Threat Scenario” column, choose from a built-in list of common threats. No need to write them yourself — just select the one that fits.

Enter details in “Impact to the Element” and “Consequence”.

Enter values in “Difficulty”, “Impact”, and their rationales.
The sheet automatically calculates a Risk Score based on your input.
Choose a strategy to reduce the risk in the “Mitigation Strategy” column
Use “Mitigation ID” and “Mitigation Detail” to track what you’re doing about it.
Fill in “Difficulty after Mitigation” and “Remaining Risk Score”.

Why It’s So Easy to Use
All of this happens inside a spreadsheet-style interface. No scripting. No linking. No digging through technical settings. It’s designed so that engineers, project leads, and even non-security experts can all work together.
Why Use Polarion for STRIDE?
Live Collaboration: Teams can work together in one platform, with auditable version history.
Scalable & Repeatable: The STRIDE approach can be reused across multiple projects with consistency.
Traceability Built-In: Behind the scenes, the worksheet links to Polarion work items, maintaining full traceability for audits.
Executable Control Measures: Mitigation actions are represented as actual work items (e.g., tasks, requirements), not just static comments.
Sensitive Data Protection: Powerful permissions allow you to restrict visibility to attack vectors and confidential threat scenarios.
Process Harmonization: STRIDE analysis is integrated into your existing workflows and templates — no separate tooling or data silos.
Requirement-Driven Mitigations: Mitigations can take the form of formalized requirements, and Polarion excels at managing traceable, versioned requirements.
Integrated Verification: Risk mitigations can be linked to test cases, review steps, or quality gates, ensuring follow-through on security controls.
Not Done in a Silo: STRIDE becomes a collaborative part of your development lifecycle, not an isolated spreadsheet-based activity.
What Nextedy Risksheet Brings to STRIDE
Excel-Style Interface: Reduces complexity for users — just fill in the table.
Role-Based STRIDE Suggestions: STRIDE threats are inferred based on the interaction type of each system element.
Visual Mapping: STRIDE categories appear as colored tags in each row.
Dynamic Risk Scoring: Pre- and post-mitigation risk values are calculated live.
Reusability: Use threat libraries and repeatable patterns across multiple systems.
Terminology Mapping for STRIDE
Conclusion
With Siemens Polarion ALM and the Nextedy Risksheet table, STRIDE-based threat modeling becomes intuitive, accessible, and maintainable. Everything happens in one interactive view — no need to link items manually or understand technical configurations.
From identifying security-relevant signals to assessing risk and defining mitigations, the Risksheet table guides users through a clear and visual workflow. This makes cybersecurity a shared responsibility across development teams and ensures compliance in regulated environments.
For a live demonstration or to try the STRIDE table with your own data, contact info@nextedy.com or request access to the hosted demo environment.